Readable Stack Traces
Learn how to get traces with line numbers and file paths in Sentry with SDK for Godot Engine.
The official Godot Engine builds only provide templates without debug information files. This guide covers how to create such templates and use them to export your project with full debug information available in Sentry.
Debug information files allow Sentry to extract stack traces and provide additional information from crash reports. In order to get stack traces that contain function names, line numbers and file paths, Sentry needs to have these debug information files available when processing the crash dumps. For that, you need to export your Godot project using an export template that contains debug information.
To get debug information, we need to compile export templates with debug symbols produced. You'll need Git, SCons build tool, Python, and a C++ compiler for your target platform installed.
Ensure you have a compatible C++ compiler. On Windows, for instance, you can use Visual Studio Community 2022 with the C++ workload installed, GCC on Linux and Clang on macOS.
Here are a few ways to install the SCons build tool:
# If you have `scoop` installed:
scoop install scons
For more information, refer to Building from Source in the official Godot documentation. It provides detailed instructions for compiling Godot on different platforms and with different tools. This guide offers streamlined instructions tailored for our use case, and may omit some details you require.
Start in a terminal with Git available. Clone Godot Engine repository and switch to your preferred version tag (or branch):
git clone https://github.com/godotengine/godot
cd godot
git checkout 4.4-stable
To compile the Godot release export template with debug symbols, run the following command:
scons platform=windows target=template_release production=yes debug_symbols=yes separate_debug_symbols=yes
Options explained
If all goes well, the export template files should appear as the result of the build process in the bin/ directory inside the Godot source tree. When using MSVC on Windows, you will find .exe files alongside .pdb files, which contain debug information.
Learn more about debug formats in Debug Information Files.
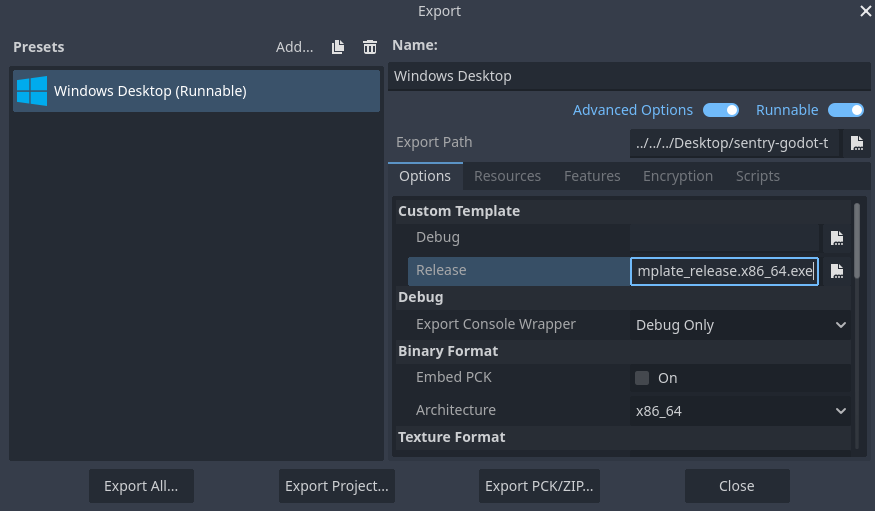
Now you can export your project using your custom template. In the Godot Export dialog window, follow these steps:
- Select or add an export preset.
- Enable the Advanced Options toggle.
- In the Options tab, under Custom Template -> Release, assign your custom template executable file.
This will configure your project to use the custom export template with the debug symbols you compiled earlier.
You should now be able to export your project using this template. Just make sure to uncheck Export with Debug in the Export Project... dialog, as you will need to compile and use the template_debug for that option.
If you need to Export with Debug, you can compile a debug template using the target=template_debug option. Debug templates enable debugging features in your export, such as breakpoints and debugger support but perform slower than a release build, therefore these are not advised when shipping the game for end users.
In order to get readable stack traces in Sentry, you also need to upload your debug symbols. The easiest way to do it is by using Sentry CLI. This tool allows you to upload the necessary debug information, making the stack traces useful for debugging.
Installing Sentry CLI
Log in to Sentry via the CLI by running the following command:
sentry-cli login
It will prompt you to create an auth token in your web browser. Follow the instructions, generate the token, and then paste it into the command-line prompt when asked.
To upload debug symbols to Sentry using sentry-cli, run the following command:
sentry-cli debug-files upload --org example-org --project example-project ./bin
This will upload the files with debug information from the ./bin directory to Sentry.
Example output:
$ sentry-cli debug-files upload --org my-sentry-org --project my-game ./bin
> Found 4 debug information files
> Prepared debug information files for upload
> Uploading completed in 7.429s
> Uploaded 4 missing debug information files
> File upload complete:

  UPLOADED 88b87add-d362-406c-b3b7-9f019072a7e0-1 (godot.windows.template_release.x86_64.console.exe; x86_64 executable)
  UPLOADED 88b87add-d362-406c-b3b7-9f019072a7e0-1 (godot.windows.template_release.x86_64.console.pdb; x86_64 debug companion)
  UPLOADED 07c660ac-3f72-4c75-8aca-1378240cc949-1 (godot.windows.template_release.x86_64.pdb; x86_64 debug companion)
  UPLOADED 07c660ac-3f72-4c75-8aca-1378240cc949-1 (godot.windows.template_release.x86_64.exe; x86_64 executable)
For more information, refer to Sentry CLI documentation.
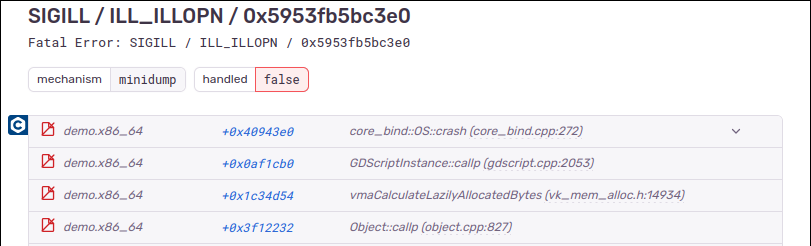
Congratulations! You're all set up. Your exported project should now produce symbolicated stack traces in Sentry.
Our documentation is open source and available on GitHub. Your contributions are welcome, whether fixing a typo (drat!) or suggesting an update ("yeah, this would be better").